PlainAPM agent configuration and frequently used options.
Can't find what you're looking for? Just ping balazs@plainapm.com
After signing up, you’ll be prompted to create a new app. PlainAPM will
then generate a new secret key, which acts as a unique identifier for
your app. PlainAPM agent expects it to be in an environment variable
called PLAIN_APM_APP_KEY. On platforms like Heroku, environment
variables can be configured in your app’s settings. It is also possible
to set the variable in a Rails initializer manually, or using a
configuration management gem:
# config/initializers/env_vars.rb
ENV['PLAIN_APM_APP_KEY'] ||= "my app key"
PlainAPM agent includes a Rails::Railtie, that will try to read the
configuration once the app initialization is complete.
In your app’s Gemfile, add the following line:
gem "plain_apm", "~> 0.10.0"
and run bundle install. Then commit and deploy these
changes. Once deployed, your app should start sending events to
PlainAPM. Hit one of your controller’s actions in production, and
the latency dashboard will start showing a table with latencies.
PlainAPM agent is configured through environment variables. They can be either passed from the command-line, or set before the Rails app initializes.
This is a list of currently supported variables:
PLAIN_APM_APP_KEY - A secret key identifying the particular application to PlainAPM.PLAIN_APM_ENDPOINT - Endpoint used for delivering application performance events.PLAIN_APM_ENABLED - To force-enable PlainAPM agent, e.g. in development.PLAIN_APM_DISABLED - To force-disable PlainAPM agent for a certain process.Right now, PlainAPM relies on Rails’ own parameter filters.
By default, Rails uses parameter filtering to remove sensitive information from request parameters and when inspecting ActiveRecord objects. These are the default settings (as of November 2022):
Rails.application.config.filter_parameters += [
  :passw, :secret, :token, :_key, :crypt, :salt, :certificate, :otp, :ssn
]
Values of parameters matching these keys will be replaced with [FILTERED] string.
More parameters can be added in initializers/filter_parameter_logging.rb initializer.
If you suspect that some sensitive information was sent to PlainAPM unintentionally, please feel free to contact our support.
PlainAPM provides a way how to manually instrument parts of code.
Lets say we have a PerformanceHelper module that is responsible for
aggregating an array of events, before they are displayed in a view.
class PerformanceHelper
  include PlainApm::Helpers

  def aggregated_trace(trace)
    plain_apm_instrument("aggregated_trace", { trace_size: trace.size }) do
      run_expensive_aggregation
    end
  end
end
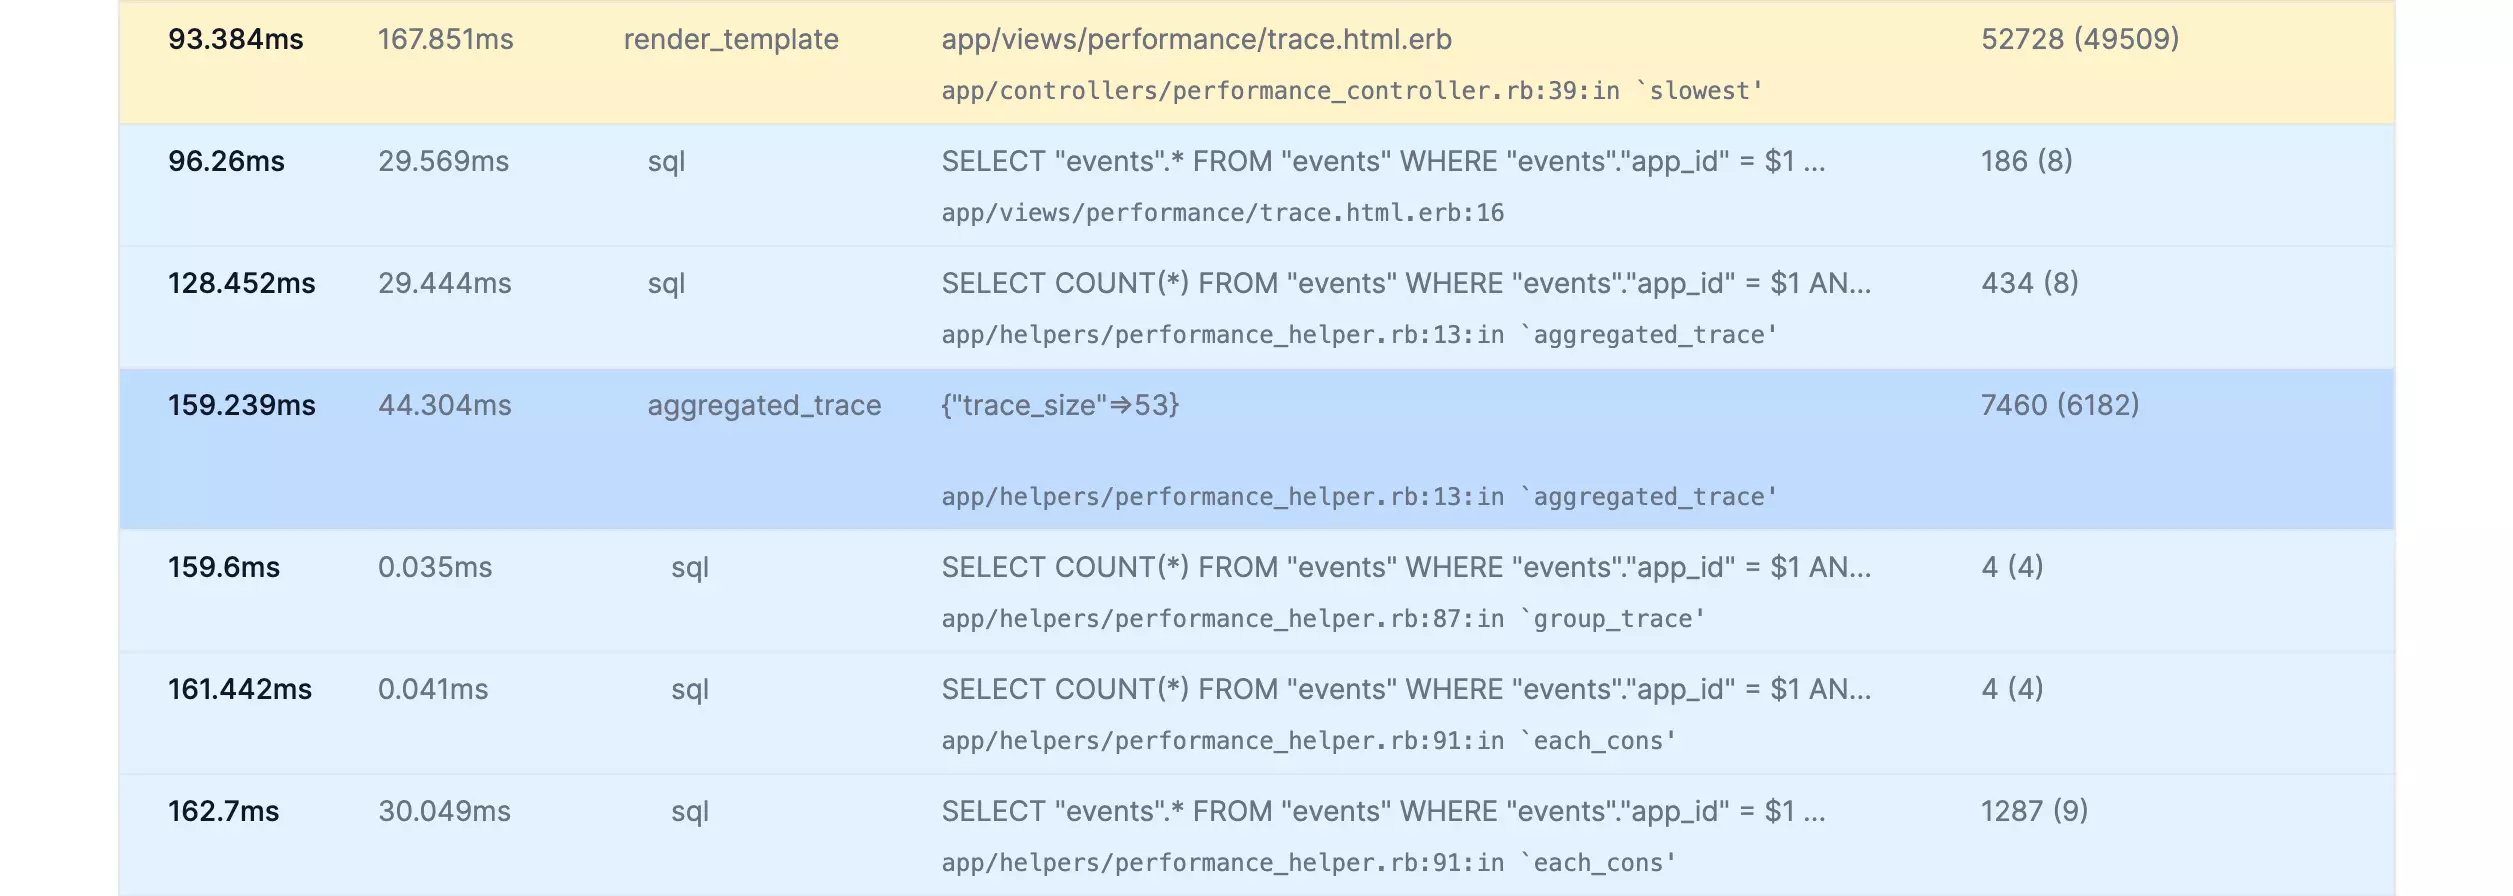
To instrument this method, we first include the PlainApm::Helpers module, then use plain_apm_instrument method to instrument a block of code. First argument - aggregated_trace - is the annotation name to make the measurement easily identifiable. Second argument is an (arbitrary) context, which will be displayed alongside the measurement.
When the trace is displayed in PlainAPM, it will now include the segment:
Transactions (requests and jobs), can be annotated using app-specific
information, that can later aid in debugging and analysing the
performance impact. This can be e.g. user_id or a subscription_name.
PlainAPM automatically recognizes two special fields user_id and
account_id and will make them available in search for filtering and
segmentation.
Let’s say we want to track the current user_id and account_id:
class ApplicationController < ActionController::Base
  include PlainApm::Helpers

  before_action :set_trace_context

  private

  def set_trace_context
    plain_apm_context(
      {
        account_id: current_account&.id,
        user_id: current_user&.id
      }.compact
    )
  end
end
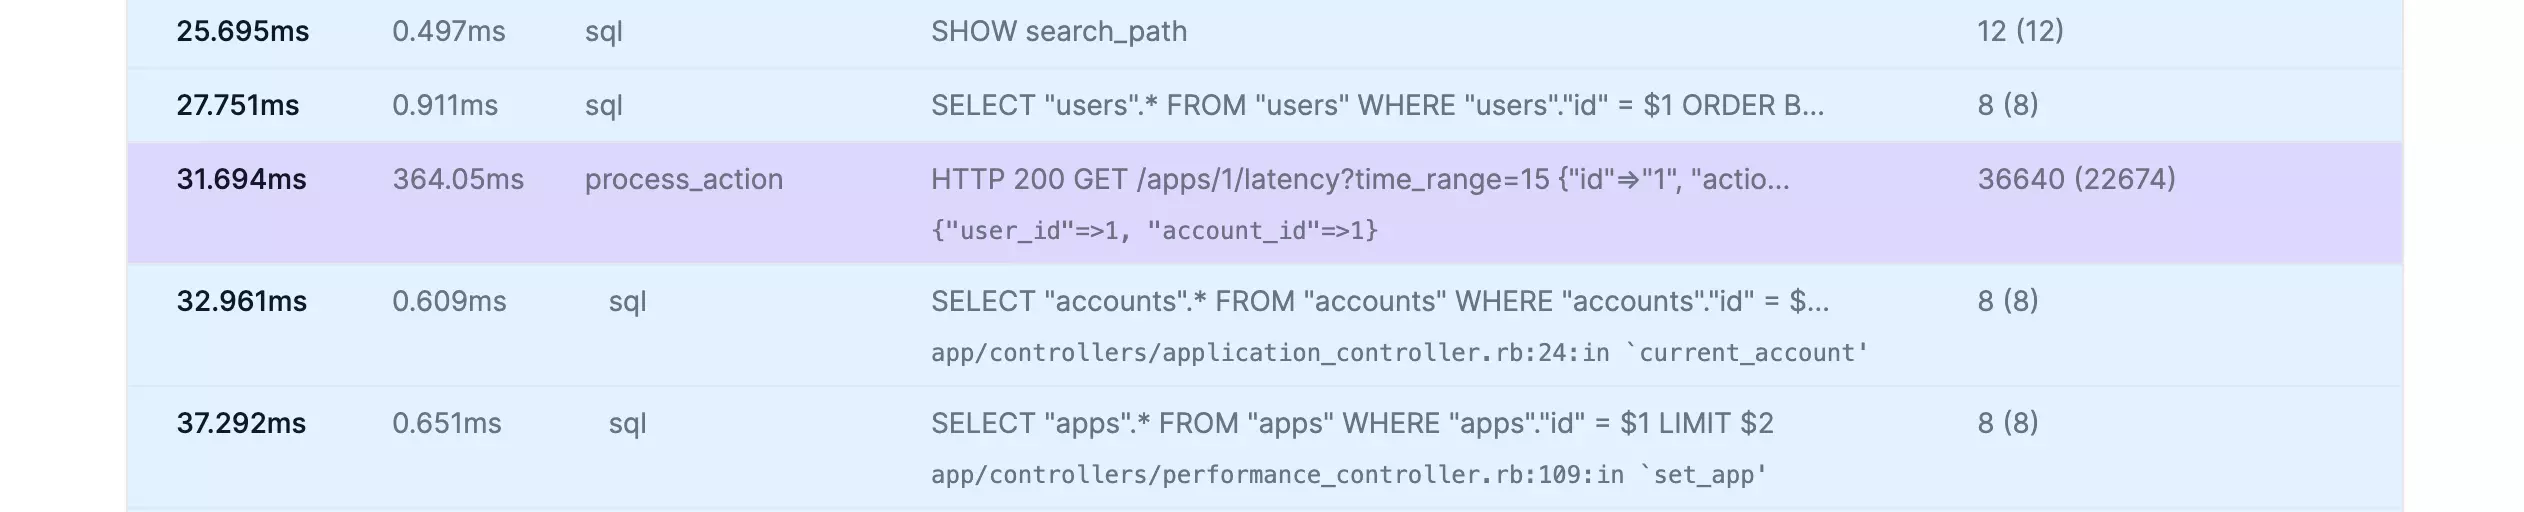
so we included the PlainApm::Helpers module into the ApplicationController, and added a before_action, which sets the context using plain_apm_context. The context will get displayed in the trace details, as part of the process_action event:
To be able to better monitor performance changes related to deployments, deployment tracking needs to be configured.
If you use git or mercurial VCS, PlainAPM should be able to automatically read the latest revision from it when the app starts.
For Heroku, an extra step is needed: we’ll need to make the deploy revision available at runtime through environment variables. This is done using the runtime-dyno-metadata lab add-on. Using the heroku CLI:
heroku labs:enable runtime-dyno-metadata -a app_name
While nothing usually beats long-term monitoring of performance in production, it is possible to use PlainAPM to get at least some ballpark estimates and to improve the baseline while the app is still in development. There’s a couple things to set up, and to keep in mind, though.
Before starting, it’s best to create a new app in PlainAPM, and use a separate app key, so that production and development data does not mix. You can always create more apps in the apps overview.
To use this key, ensure the app can access it through the
PLAIN_APM_APP_KEY=<your app key> environment variable.
By default, the agent does not start unless the environment is production. In order to enable it, pass PLAIN_APM_ENABLED=1 as an environment variable, too.
Some things to be aware of - they mostly boil down to ‘development is not production’ and an important caveat about costs:
config.consider_all_requests_local option is set to true. This will cause detailed debugging information to be shown in the HTTP response. The exceptions are caught in the process, and so they’re not reported to PlainAPM.Because of this, you might want to consider creating a separate environment for benchmarking, with production like settings, but with a separate database.
Finally, something to watch out for: Events sent to PlainAPM from any environment would count towards billable transactions. It might be a good idea to disable the PlainAPM agent again before running any local benchmarks.
