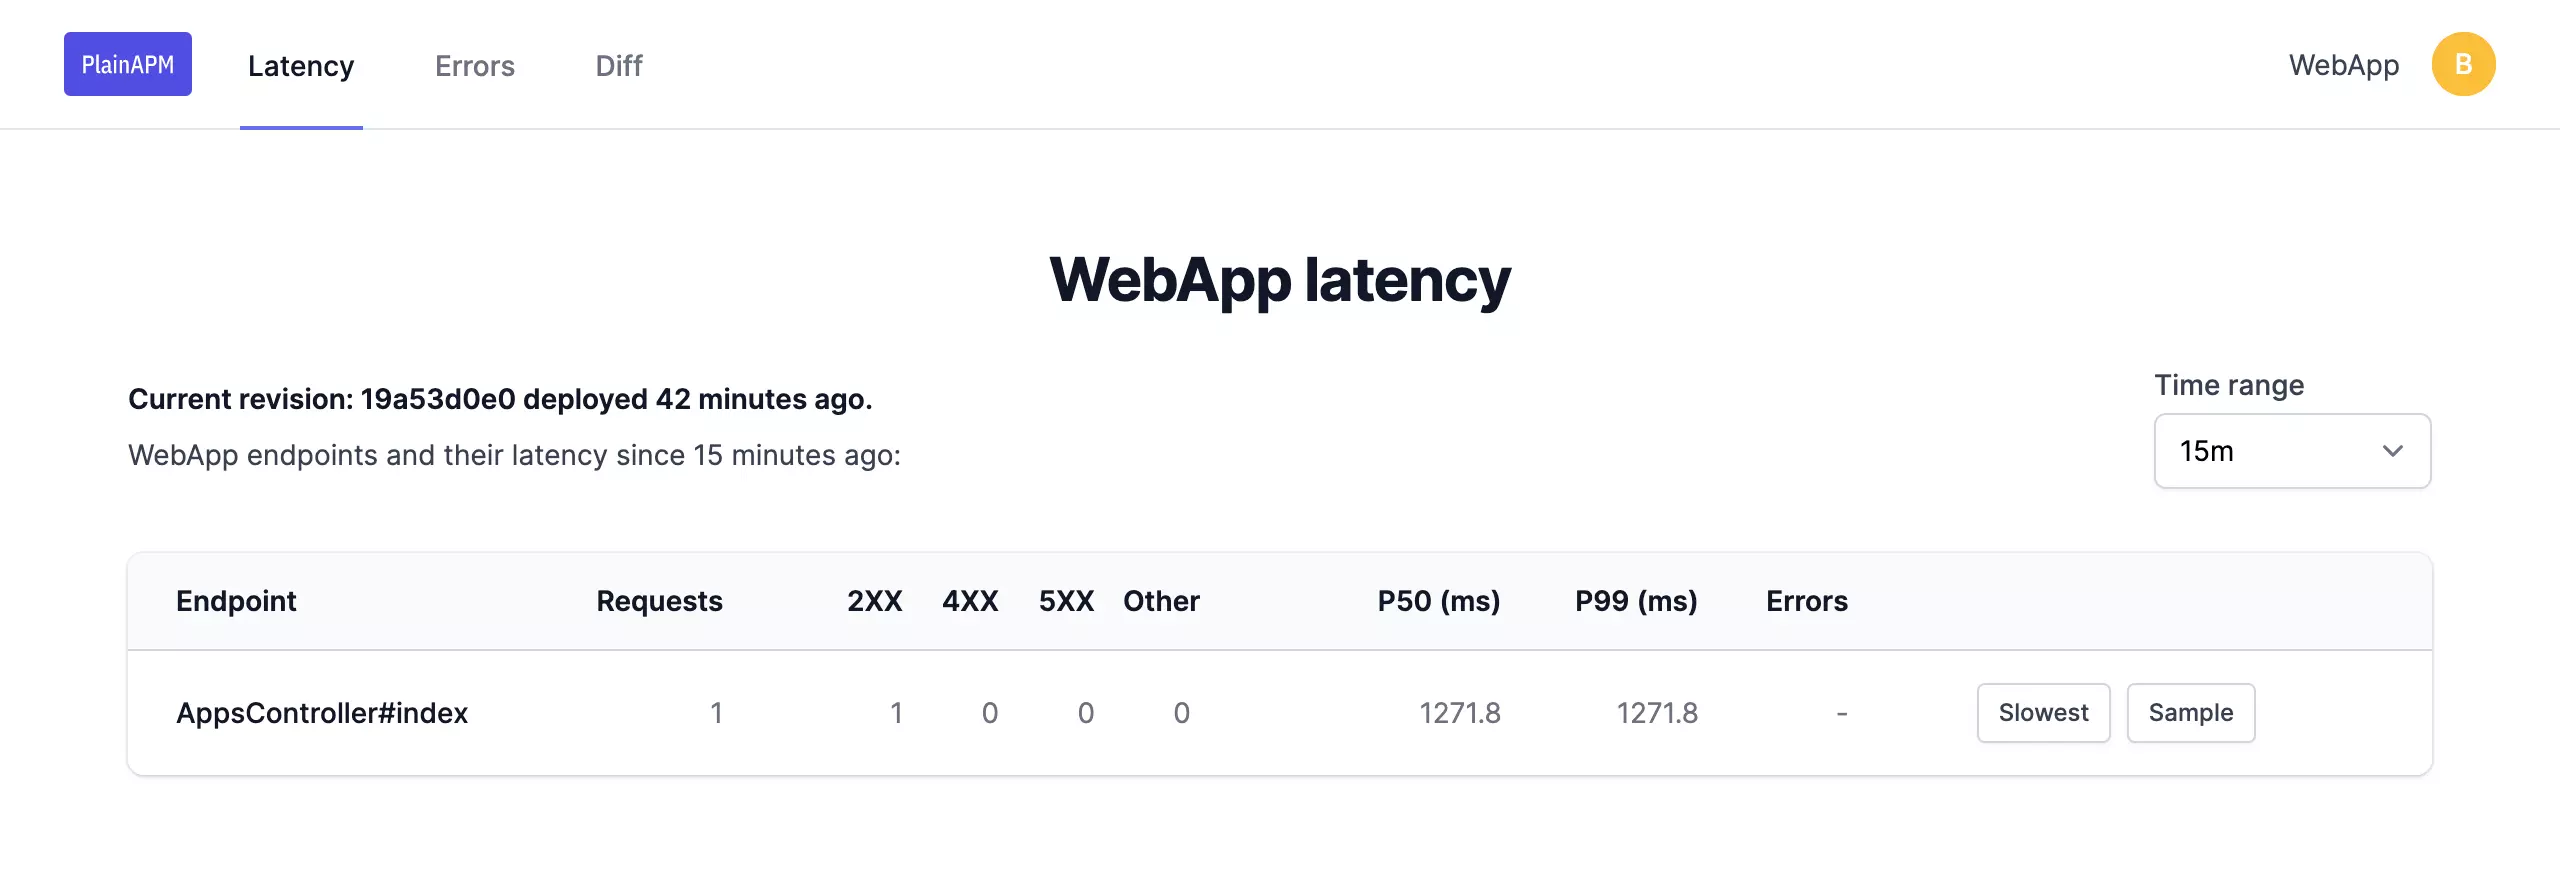
New features and improvements to PlainAPM.
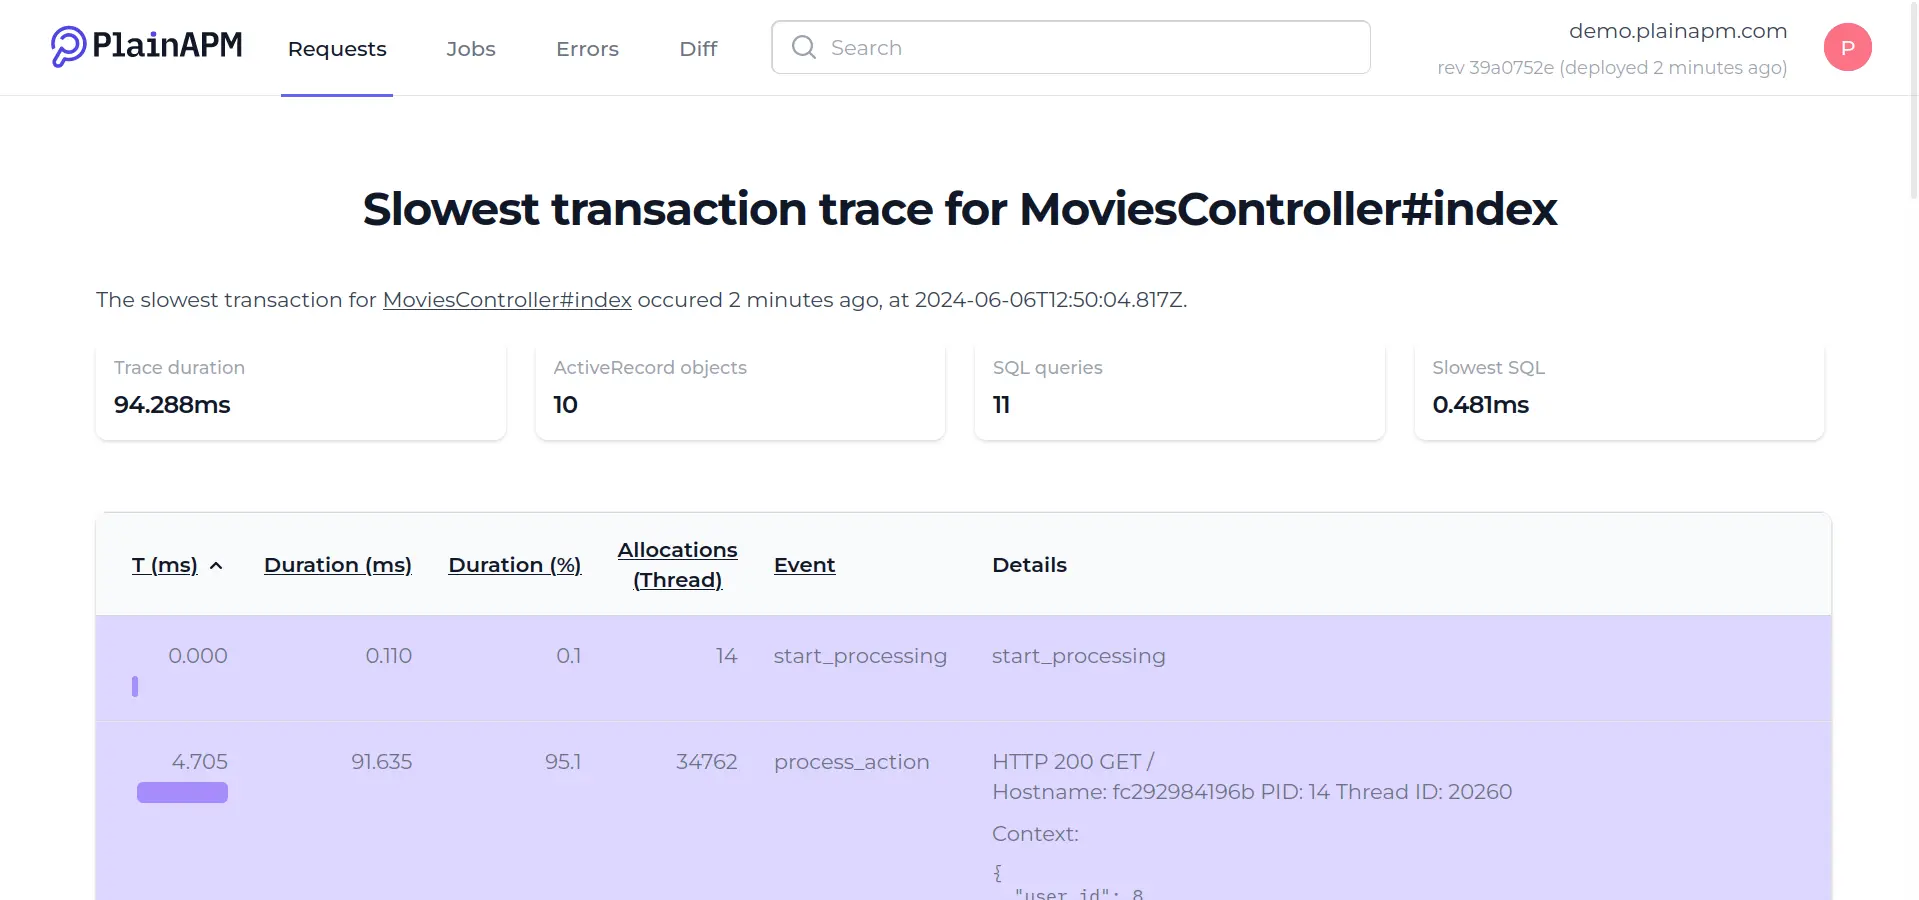
Improving on answering ‘why was X slow’, traces now contain some statistics which are typically causes for slowdowns in requests and jobs:
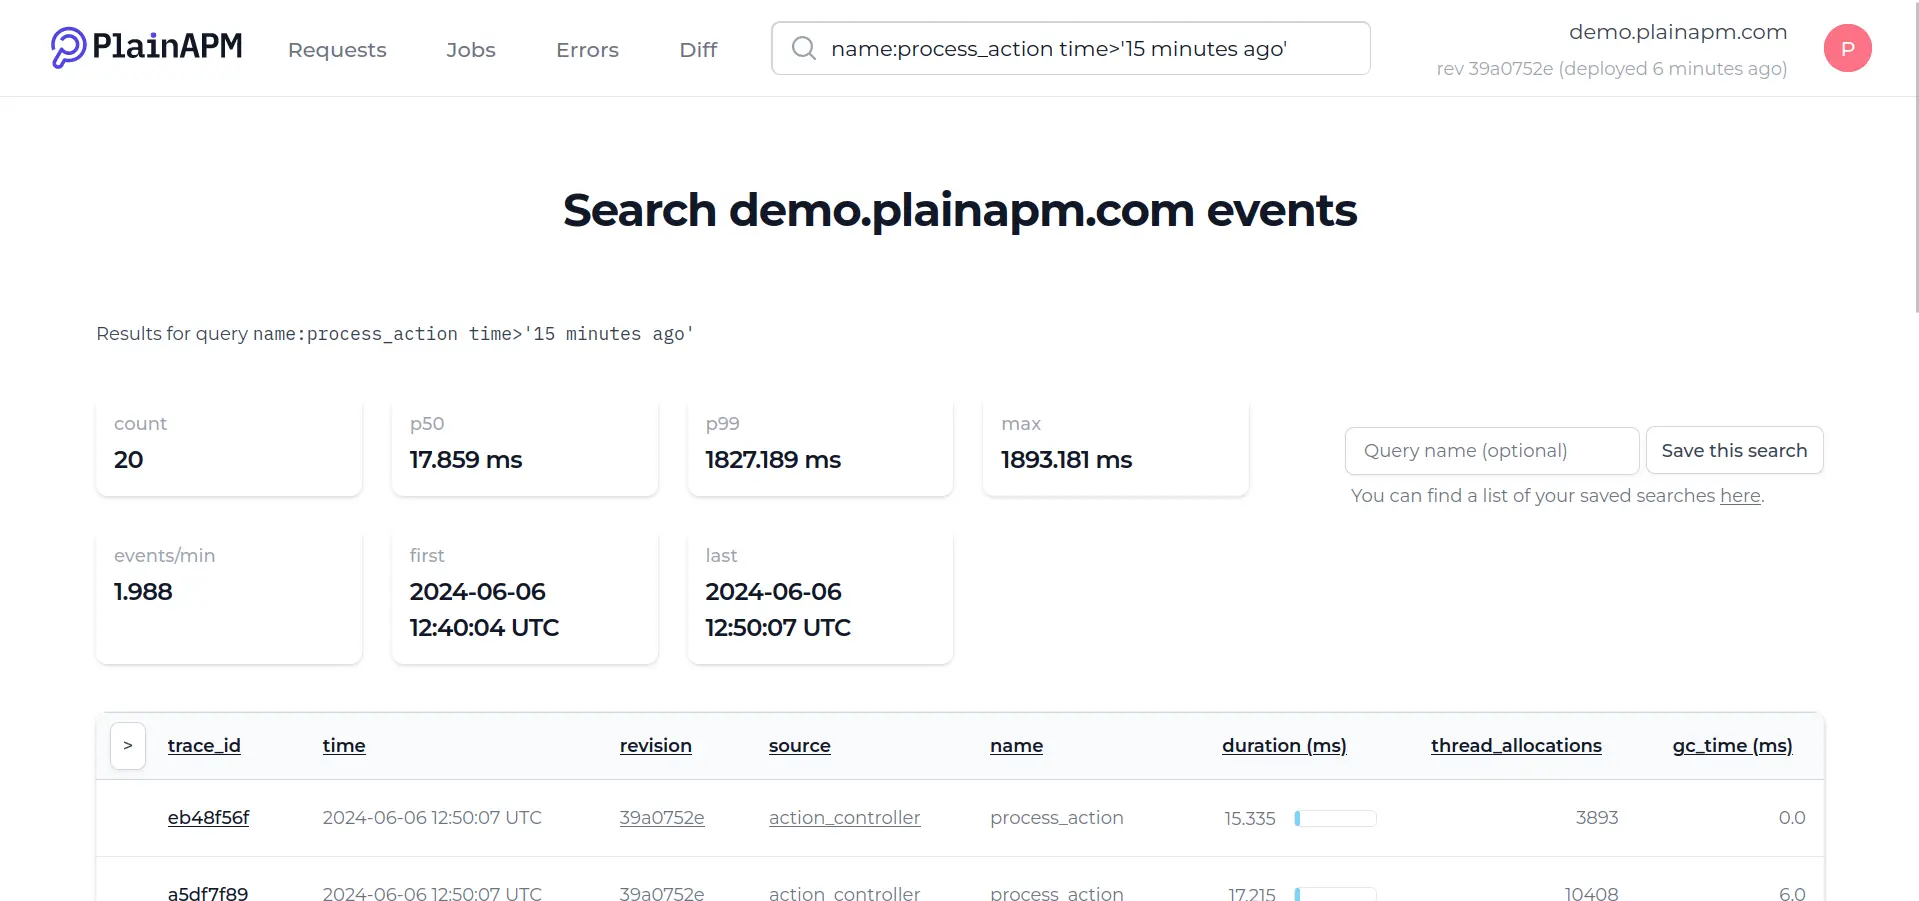
Similarly, the search results now contain summary statistics of the search results, which can help get the feel for throughput and/or latency of the resulting events:
To see the current heavy hitters easily, the requests, jobs, and transaction tables can be sorted by relative time %:

PlainAPM agent v0.10.0 just landed on rubygems.org.
While it is mostly a bugfixing release, there’s a small tweak useful for
Rails apps running on Dokku - as Dokku exposes
current app revision through the GIT_REV environment variable, the
agent picks it up and uses it to track deployments automatically.
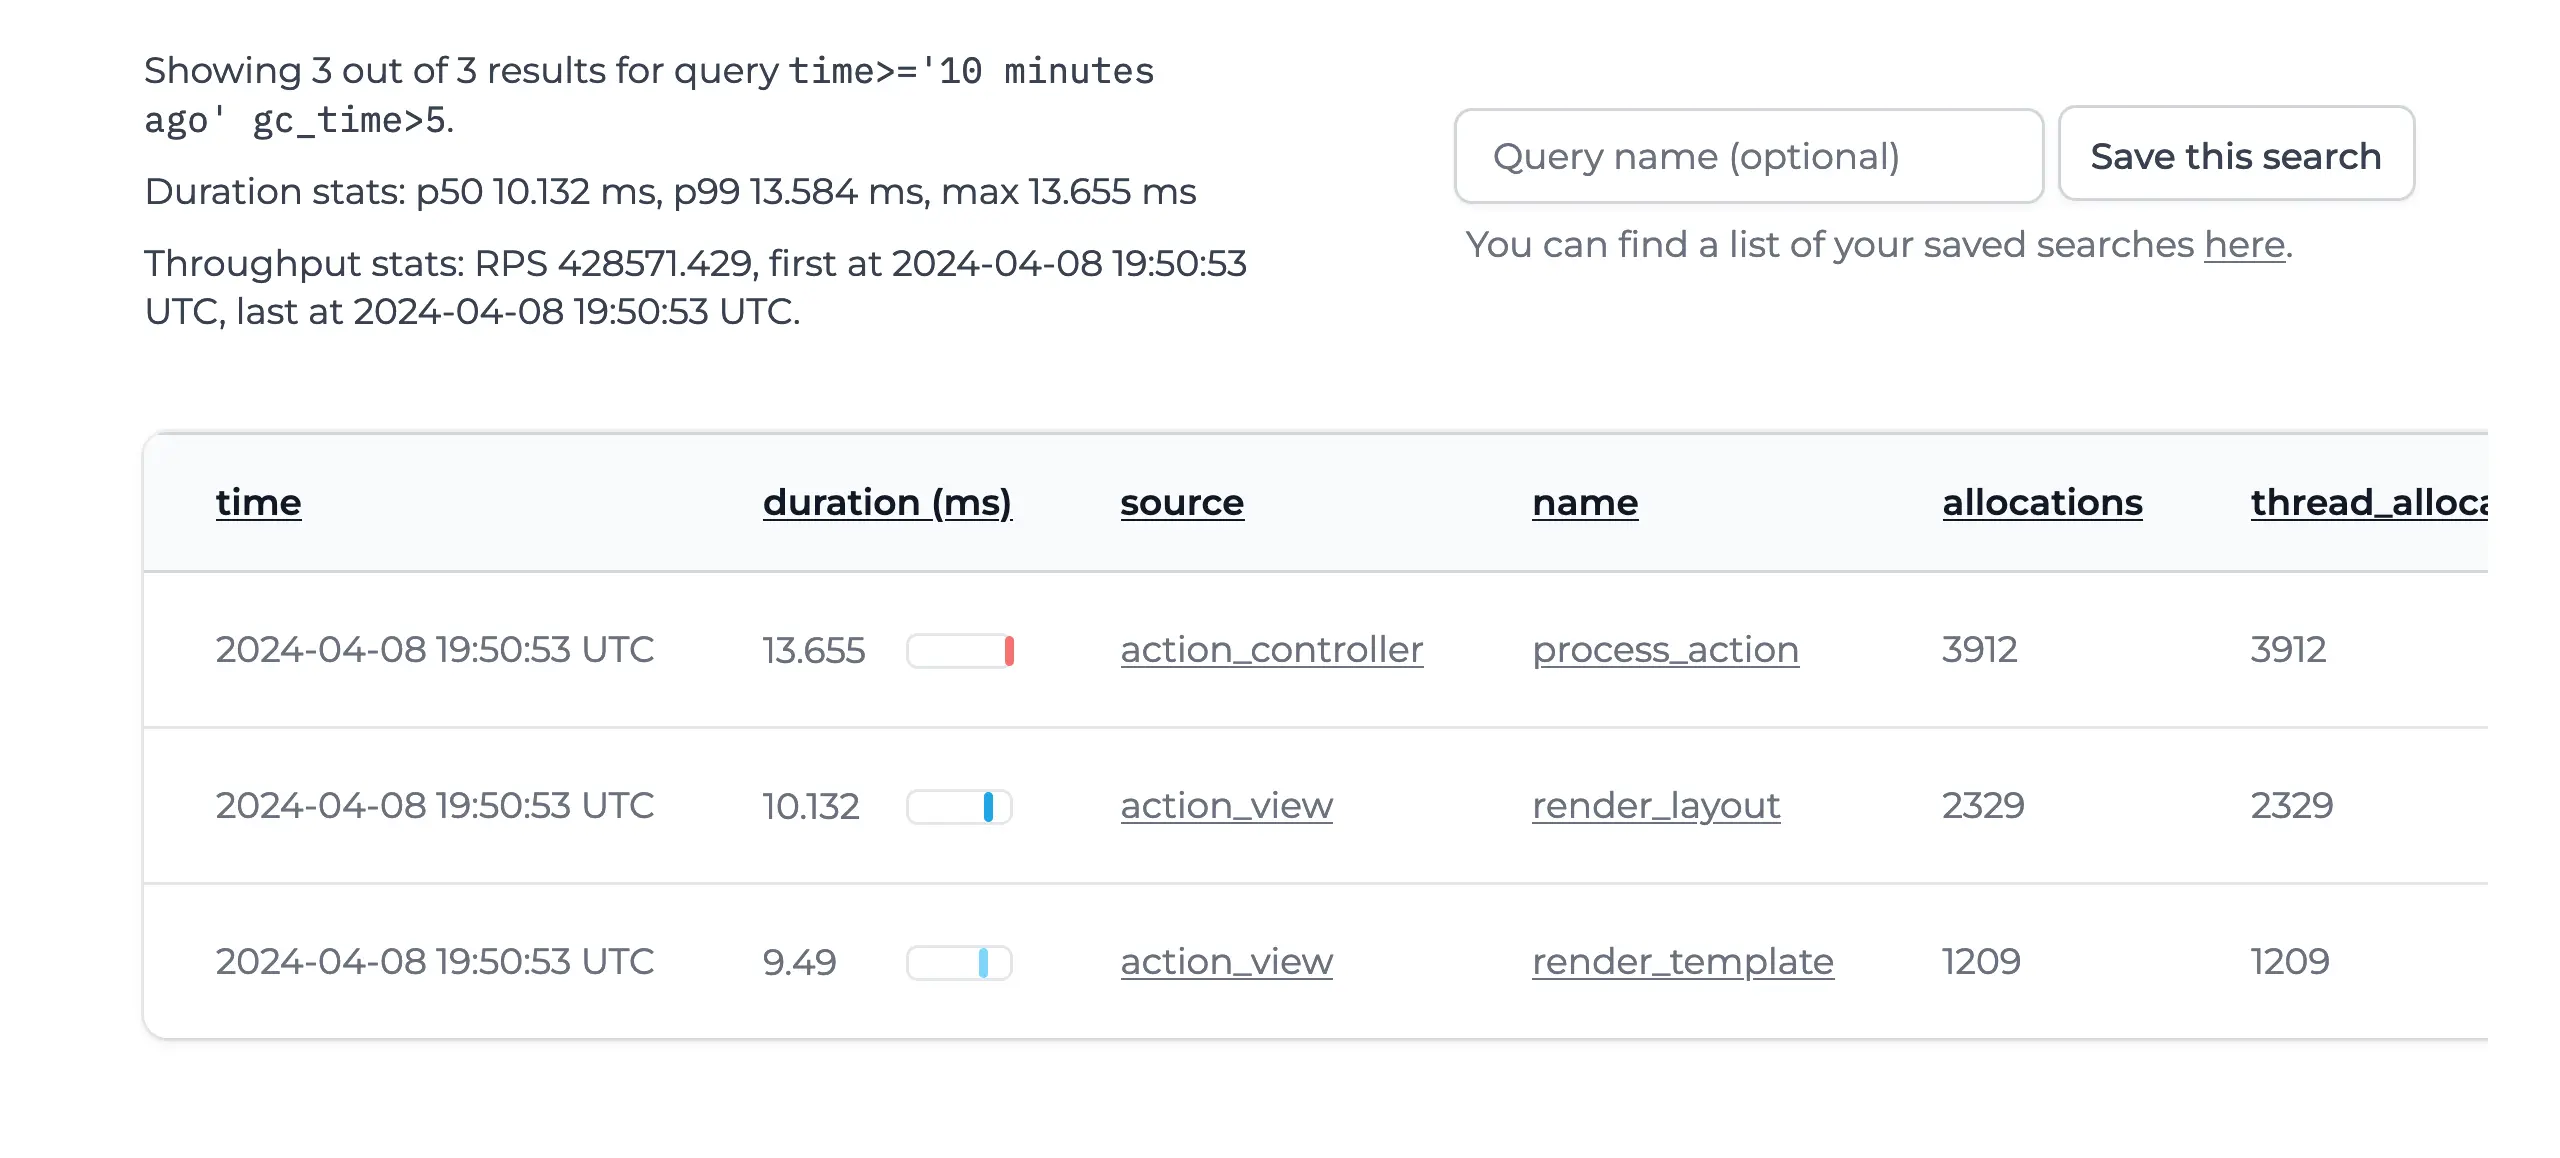
Version 0.9.8 of the agent gathers additional data: GC stats and CPU time spent in thread:
gc_time - time spent in the garbage collector.gc_major_count - number of major (full) garbage collections.gc_minor_count - number of minor (young objects) garbage
collections.This allows searching for events where GC took longer than a certain threshold:
Another tweak is that if the info is present, exceptions are now annotated by the current controller + endpoint, or job class + queue, which are available for searching:

Search queries can now be stored for later:
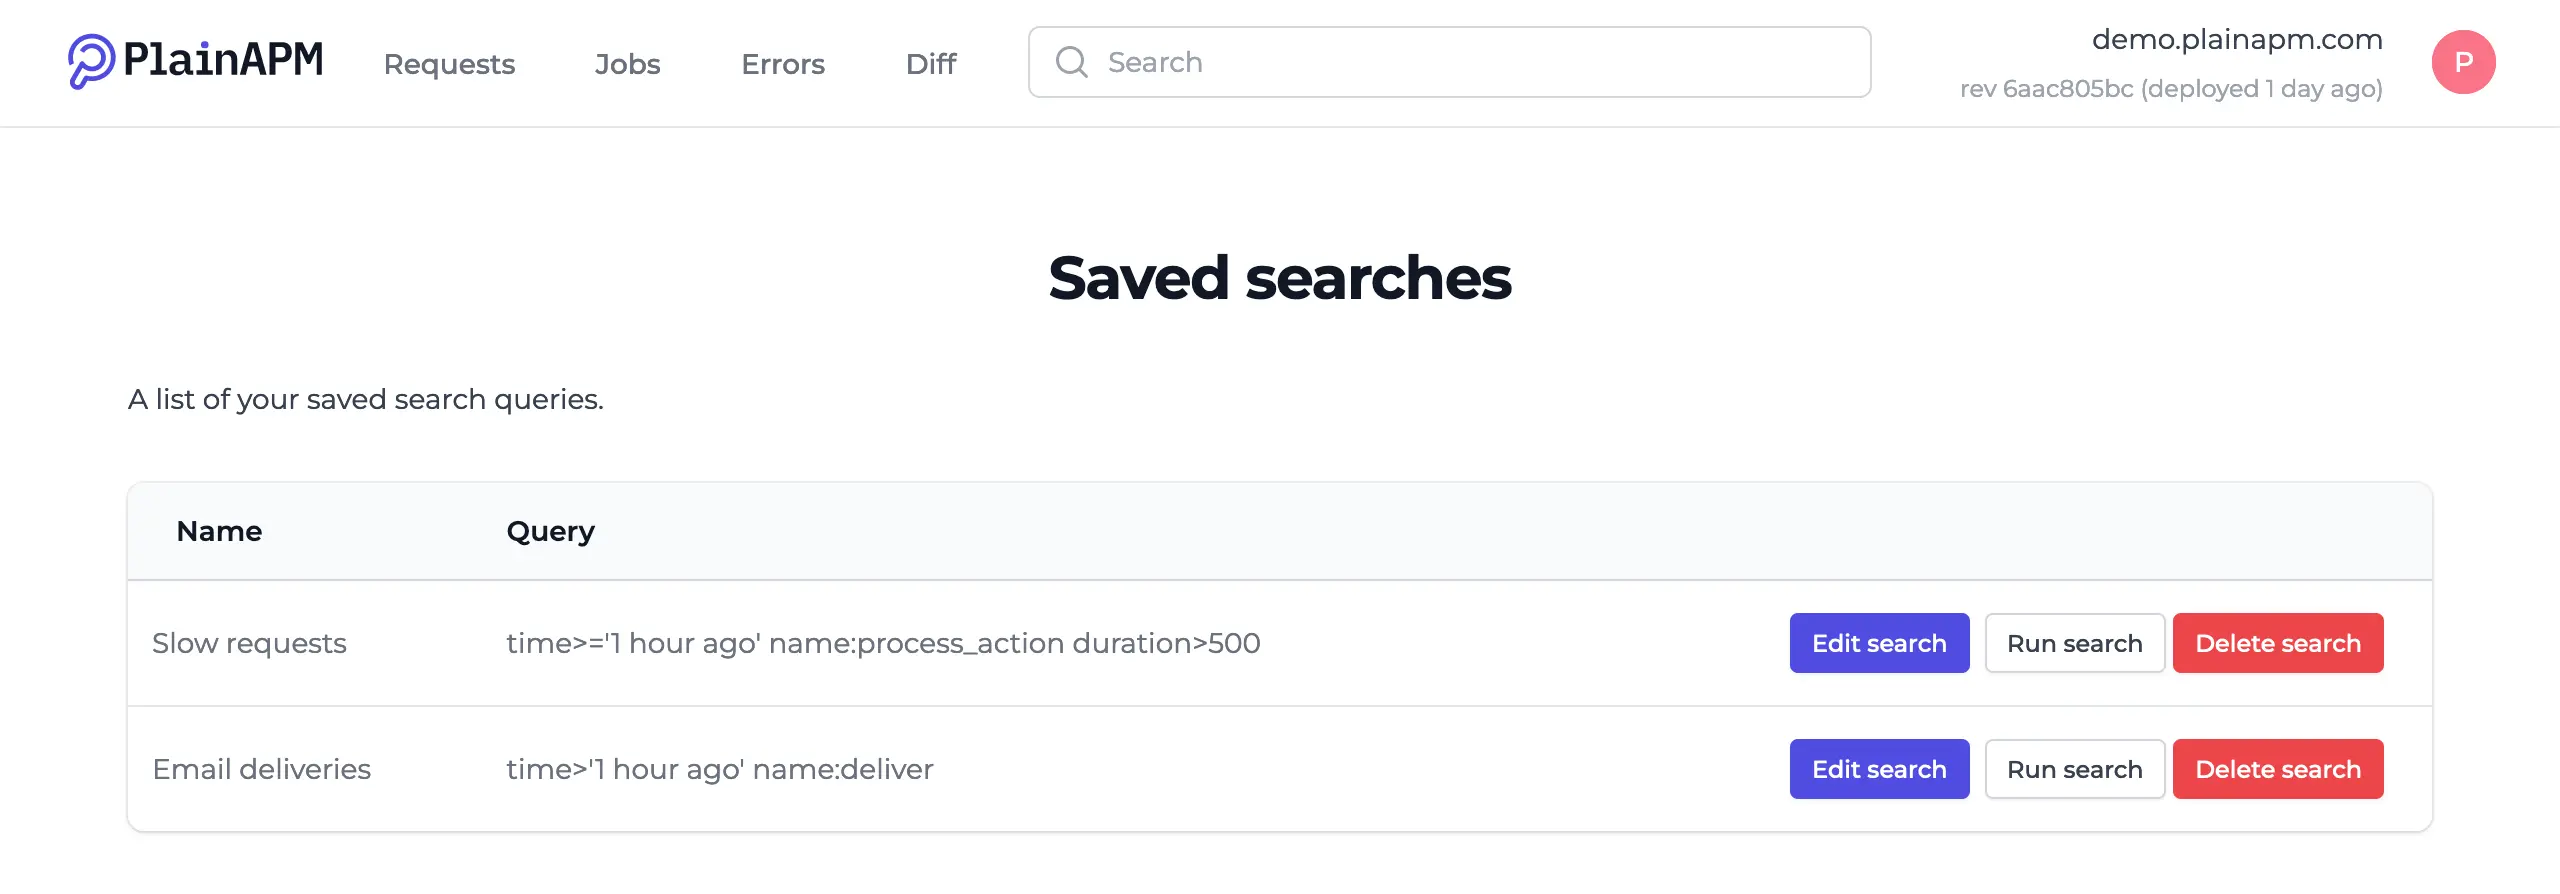
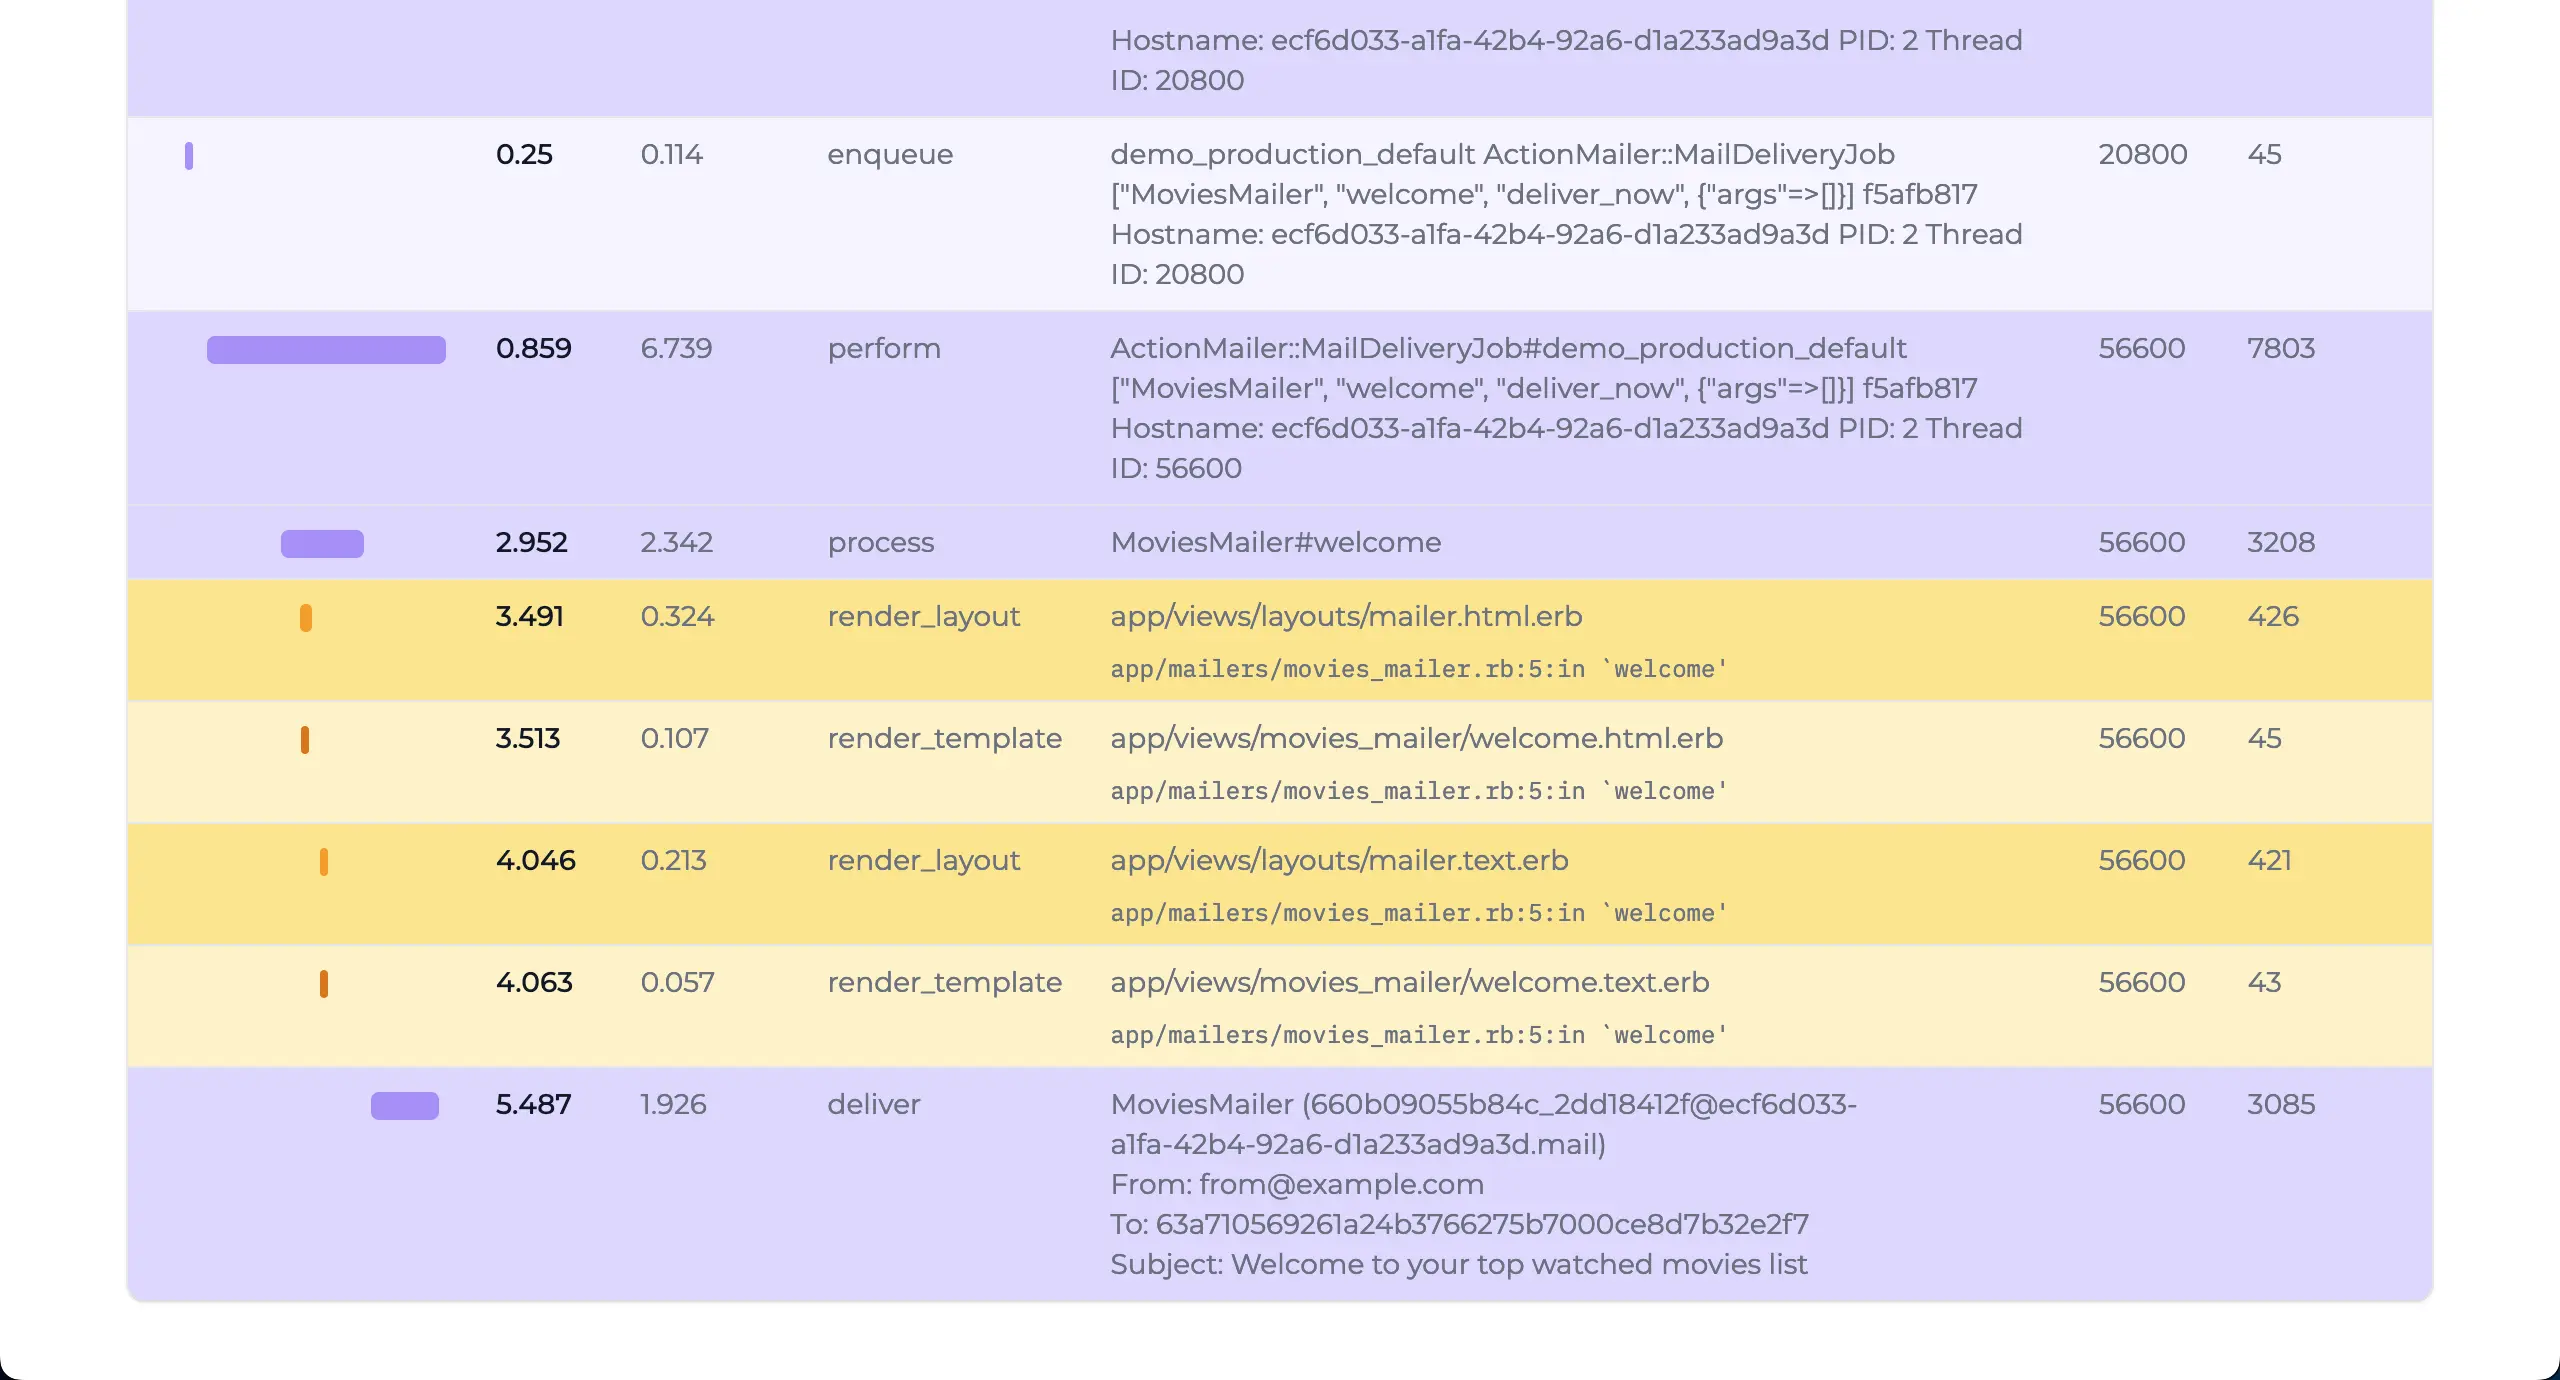
While prior releases since 0.9.4 were bug fixes, version 0.9.7 of the Ruby agent brings improved tracking of action mailer - the agent now collects the subject, sender, and a hashed list of recipients, and the app has been updated to allow searching these fields and displaying them in traces.
This should help debugging deliverability/mailer problems:
Version 0.9.3 of the Ruby gem/agent was a result of benchmarking and profiling the existing code. Besides performance improvements, there are three updates:
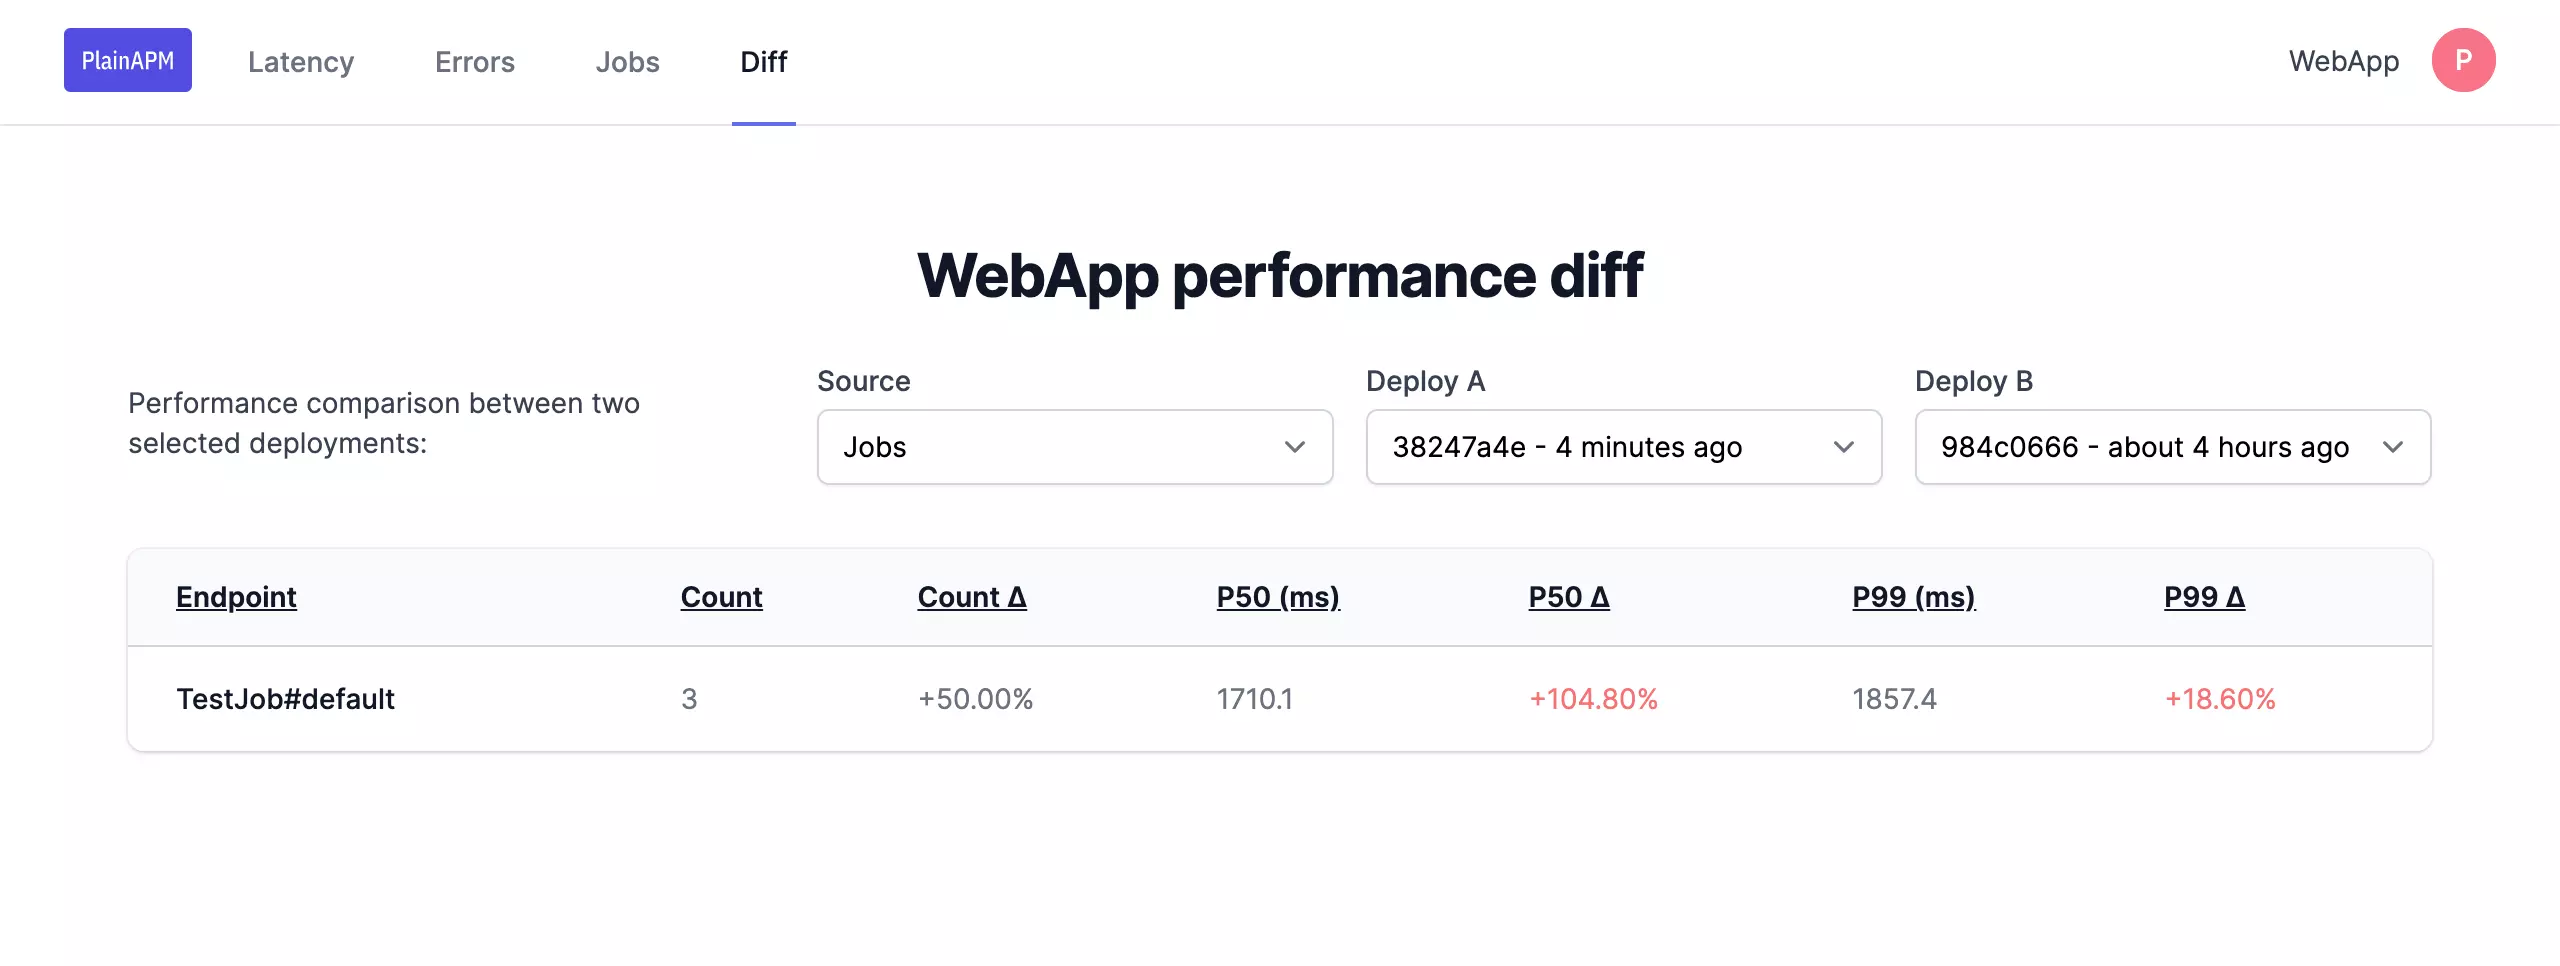
A new bit just landed in PlainAPM:
It is now possible to show a diff of job performance between two deployments.
We now released two important enhancements:
ActiveSupport::CacheStore events are now instrumented and displayed in the UI.

This week was mostly about small improvements to the UI and responding to reported issues:
