An uncluttered view of your Rails app's performance

Get instant insights into the whys and whens. No frills, no bells & whistles. Plain APM.

In app screenshot showing PlainAPM request trace

What can it do for you?

The tool

For debugging in production

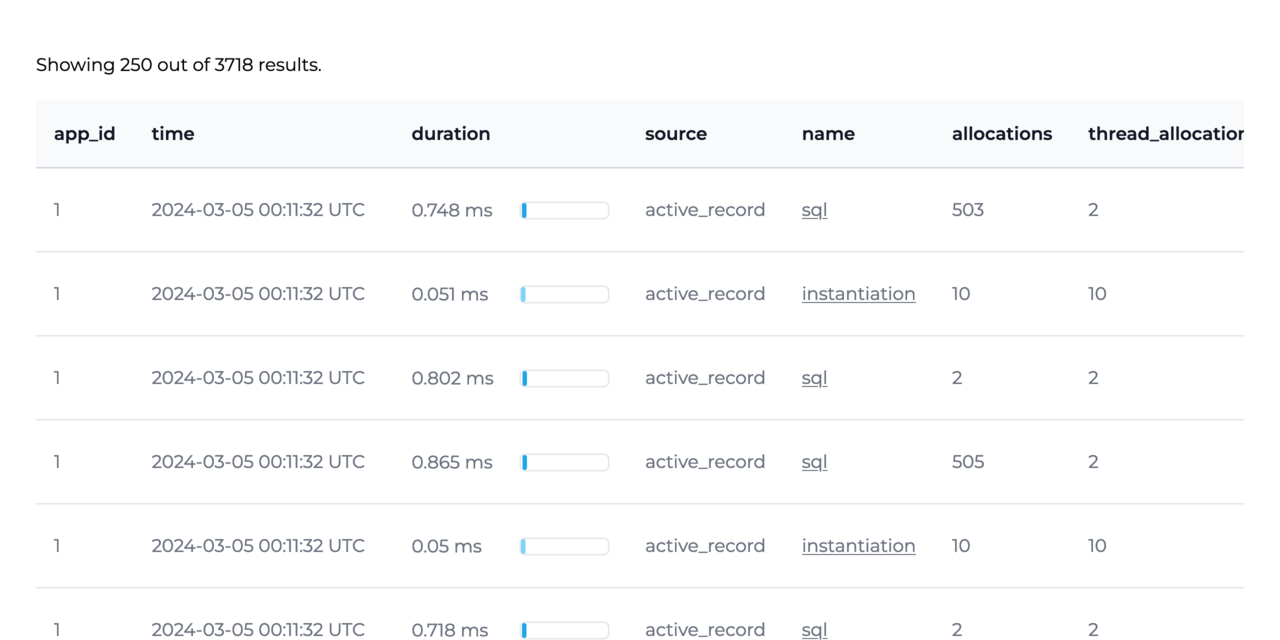
Analysing traces and searching through events with rich metadata allows you to easily debug production issues - from finding the infamous N+1 queries, to checking email sends.
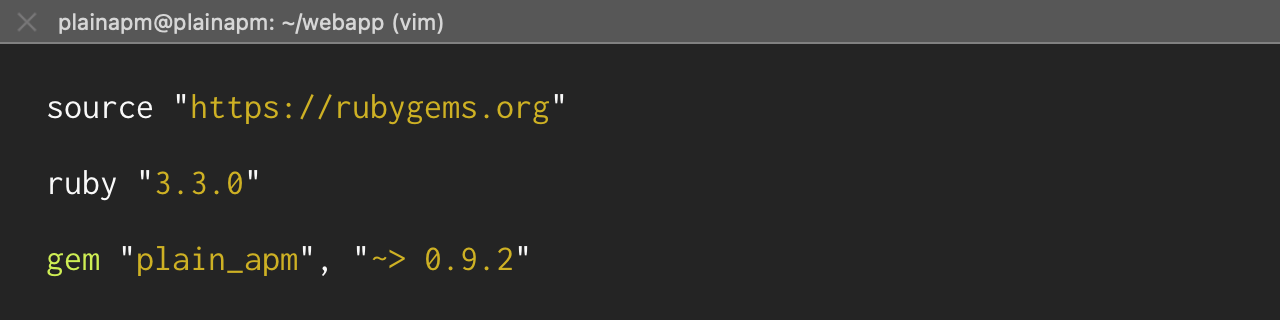
Find slow queries
Search through SQL events to spot complex/expensive queries, then check the corresponding request/job traces to get more context about their purpose and whether they can be optimized. Events also contain a source location, pointing to the file and line where the SQL query ran.
Analyze request and job executions
All the events associated with a request or a job are displayed in a comprehensive waterfall trace. The events are color-coded by subsystems (e.g. ActionView/ActiveRecord), so you can visually grep for things that are out of place - e.g. a complex view with too many partials, or a lurking N+1.
Detect allocation hotspots
Find requests, jobs, or views that allocate a large number of objects. For ActiveRecord queries, model instantiations are tracked, so you can consider optimizing them with .pluck.
Uncover user behavior in your app
User ID and Account ID can be used as a search dimension when added to the event context. This allows you to understand e.g. what requests were made before a user encountered a bug.
Track email sends
Ever needed to check which emails were going to user X? Simply search by a user ID or a hashed recipient email address.
Trace jobs spawned from requests
ActiveJob events are automatically annotated with the trace ID of the request that spawned them. This makes it possible to see which users/requests triggered the job, e.g. an asynchronous email delivery.
Get temporal context for exceptions
Exception events are linked to the request or a job where they occured. Viewing the complete trace helps with understanding what happened immediately before an exception got raised.

How does it work?

Simple setup.

Update your Gemfile, run bundle install, add an environment variable with the app key and you're good to go.
A Ruby Gemfile with PlainAPM gem pinned to version 0.9.2

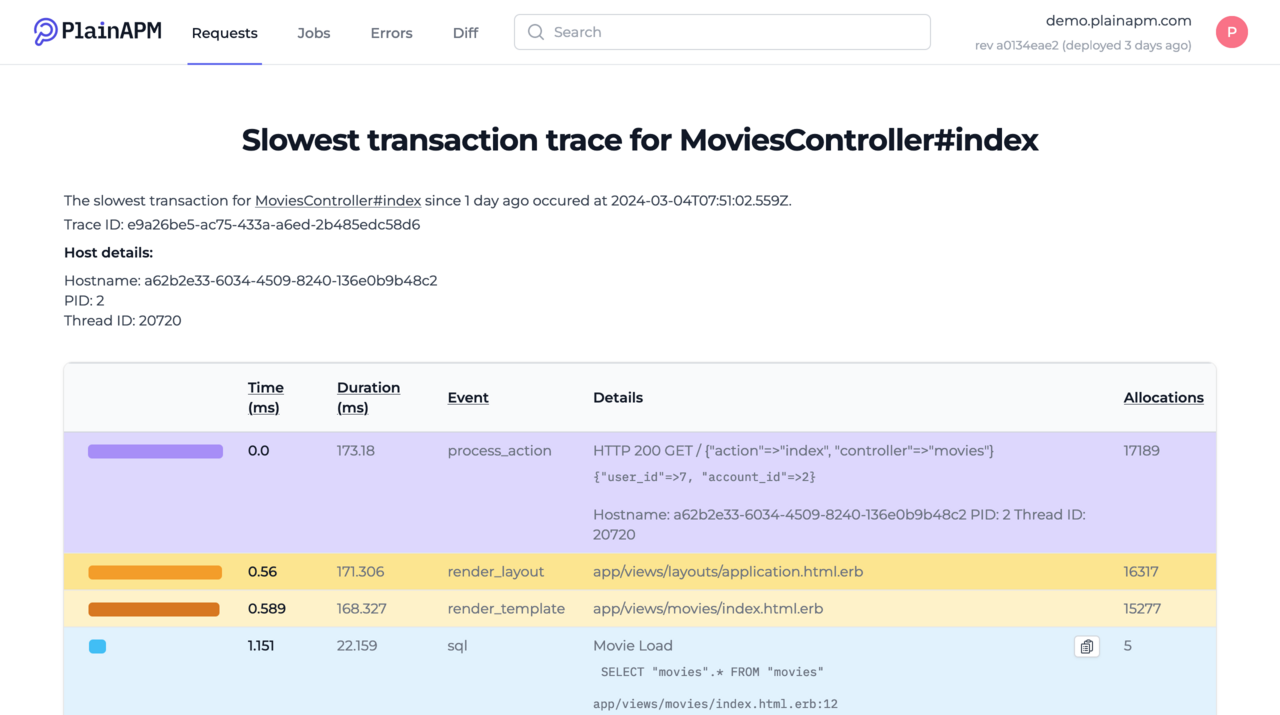
Automatic instrumentation and traces

Every Rails component is now instrumented. PlainAPM collects events from ActiveRecord, ActionController, ActiveJob and other Rails subsystems. With a treasure trove of metadata that helps you identify what's slow, and without requiring you to write a single line of code. Of course, you can add more context to the traces, and instrument your own code, too.
A Rails request trace, a list of ActionController, ActiveRecord and ActionView events and their attributes

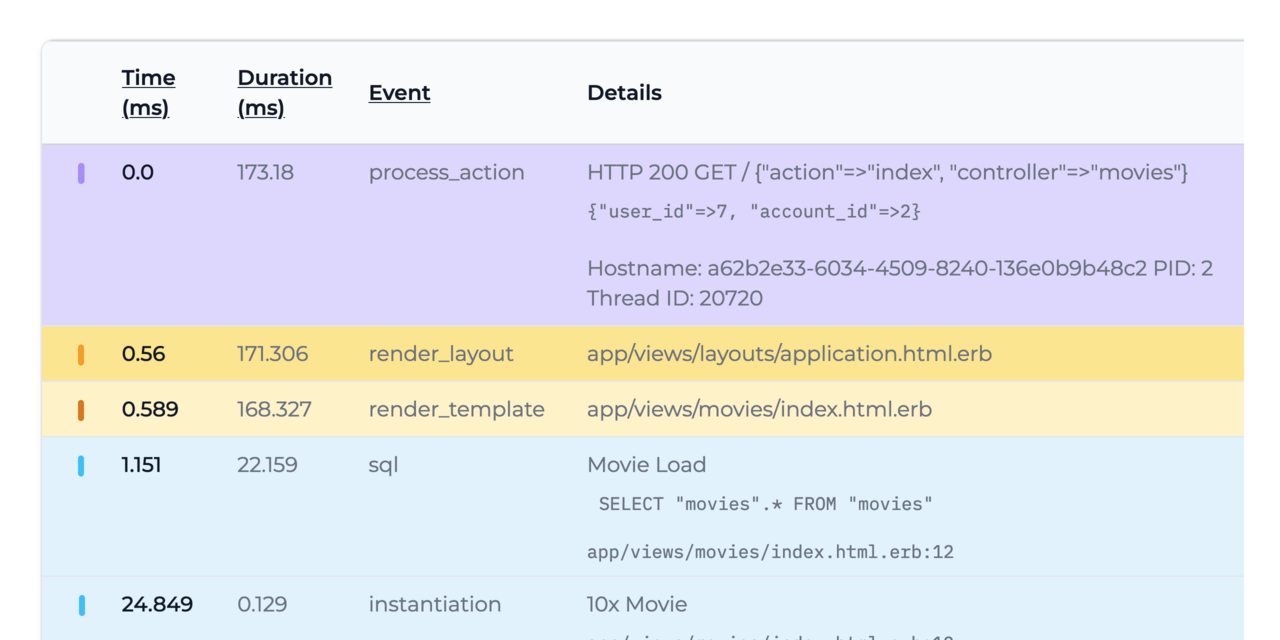
Uncover performance issues, fast
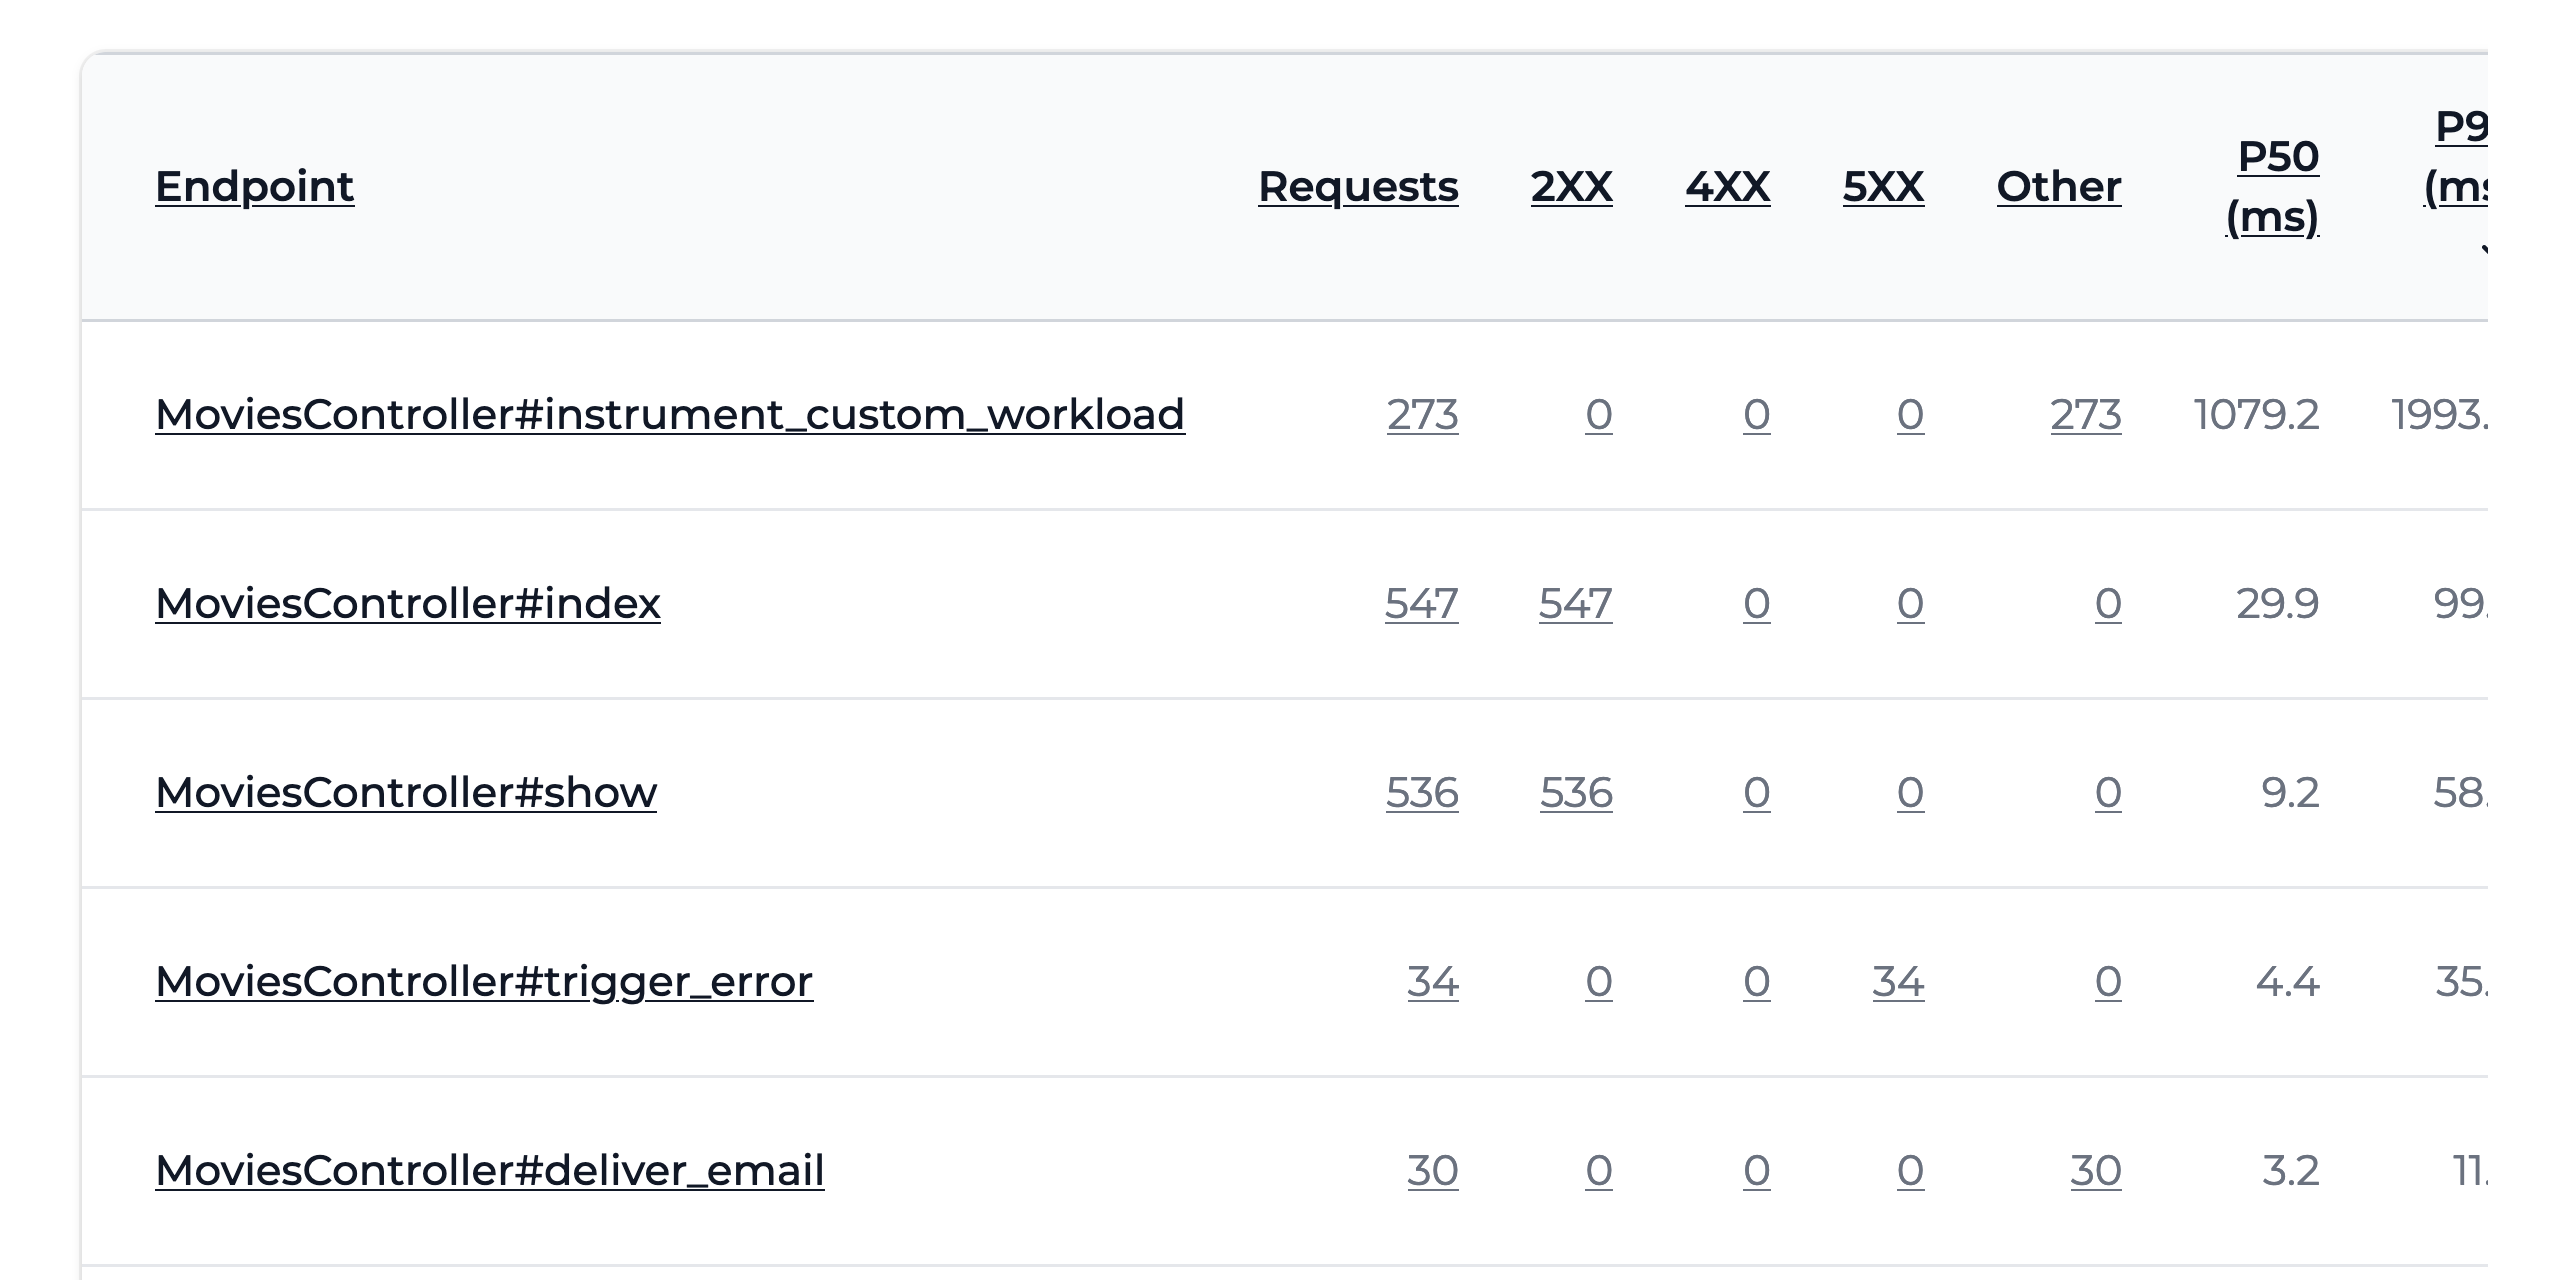
Our guiding principles to help you with debugging are KISS, to display only what matters, and the USE methodology (Utilisation, Saturation and Errors) — a proven way of uncovering performance issues.
A table showing Rails controller endpoints, request counts, and median / P99 latencies

Powerful search

All the events are immediately available for search. Filter by attributes like duration, time and deployment revision, and see outliers easily. Add user ID and account ID as extra search dimensions to find the impact and decide on the priority.
A table with Rails app events matching search criteria

Pricing

A single plan. Really?

No per-seat, per-node or per-app, no hidden fees. Based purely on transactions (requests and async jobs) made across all your organization's apps.

Plain & simple

  • Unlimited hosts and apps

  • Transaction tracing, automatic instrumentation, custom events

  • Deployment tracking, powerful search

  • 7 days data retention

$15/mo USD

for every block of 250k transactions used.

30 days money back guarantee if you find out its not your kind of APM.

Frequently asked questions

What counts as a transaction?
Either your app handling a request, or performing a background job. At the end of the month, we sum up transactions from all your apps to determine the price.
How can I get support?
Feel free to contact us via email.