🎉 There’s been quite some changes happening to PlainAPM in April, so here’s a quick summary:
Yeah, the least visible, yet probably the most important. PlainAPM is now hosted on a new infrastructure, which means things are faster and more scalable.
The agent now collects per-thread time spent on the CPU, and also GC
stats - gc_time and gc_major/gc_minor counts.
This allows e.g. searching for jobs or requests that were affected by long GC pauses:
Sign up for the beta if you’d like to try it out for your app.
Speaking of search, the search results have been streamlined, so they show only the most important attributes & metrics by default, with the full view being accessible by clicking on an ‘expand’ button.
Apps view displays aggregated stats/estimated costs for the current month, giving a quick overview of the current app’s status.
The UI remembers the last page visited, and logging in/opening the app automatically redirects there, so it is possible to continue from where you left off.
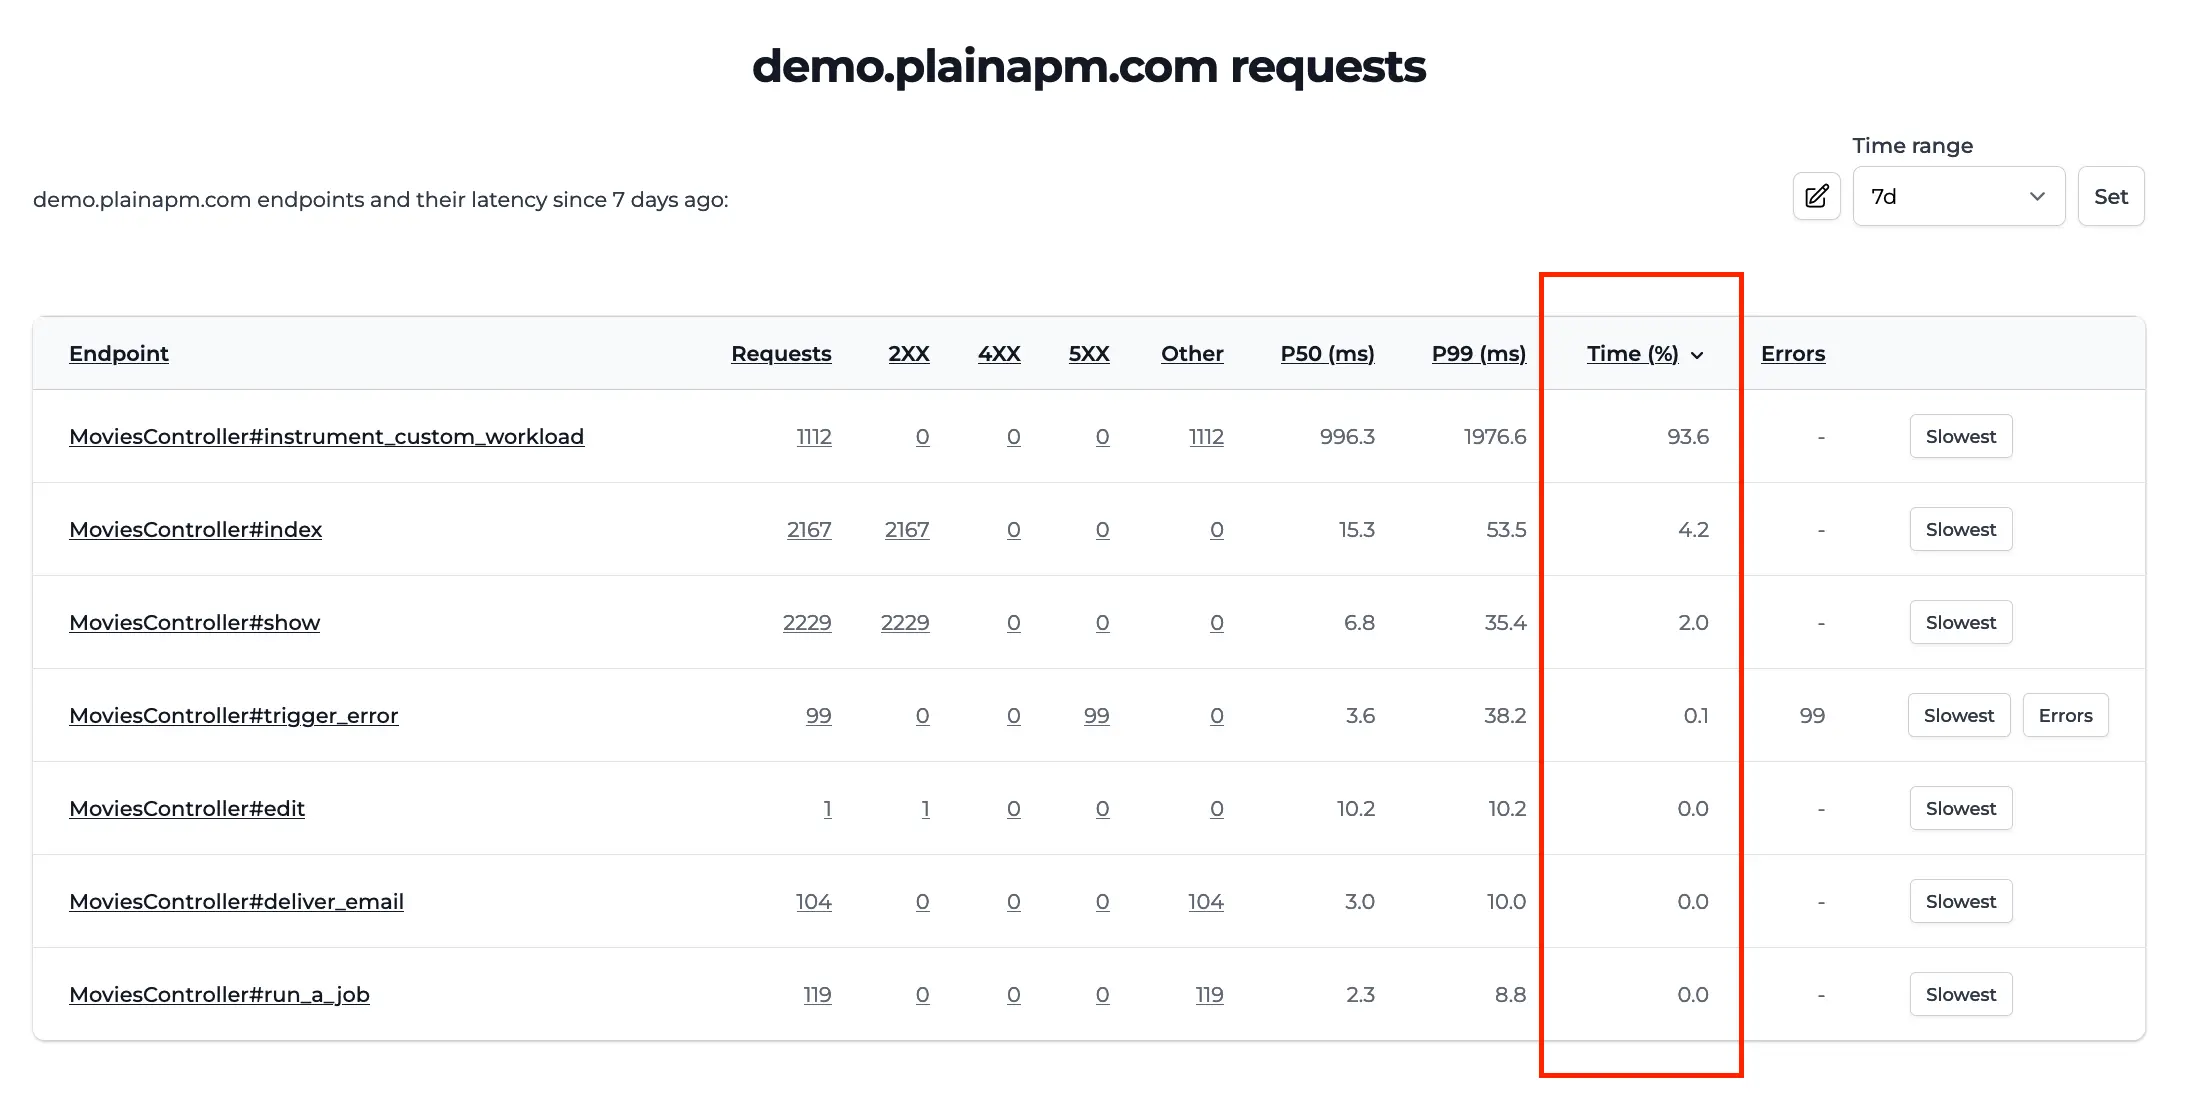
Requests/jobs tables show a relative % time spent in a given transaction, which makes it easy to spot current heavy-hitters:

Thanks to everyone who contributed their feedback!
PII filtering. While the agent currently depends on the instrumented app’s
Rails.application.config.filter_parameters settings,
this isn’t 100% dependable. It also relies on the developer
configuring - mostly adding - extra filters to scrub PII and other
sensitive data from attributes and queries. A PII filter would make
it less likely for that data to ever hit the database.
Improved span context passing across Process/Thread/Fibers boundaries. And, as there are different conventions and standards when it comes to passing the trace context across systems, we should pick & support the most widely accepted one(s), for better future interoperability.
by Balázs